What kind of marketing tools are available in SalesPartner?
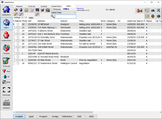
First let's import and analyse 36 months worth of residential sales data from your farming area.
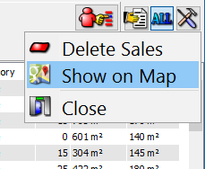
In Gallery, open Tools > Show on Map to visualize the sales.
Notes: Initial Location processing can take several minutes depending on the size of the data set. As a rough guideline you should aim to select at least 500 sale records for a large suburb.
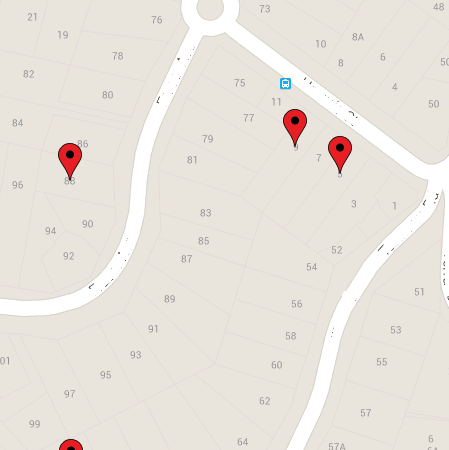 |  |
You'll often see patterns where sales occur more frequently in certain streets and areas. Your local market knowledge can shed insight into reasons why.
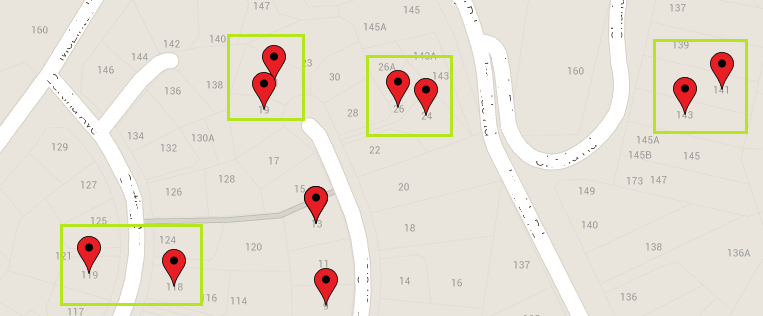
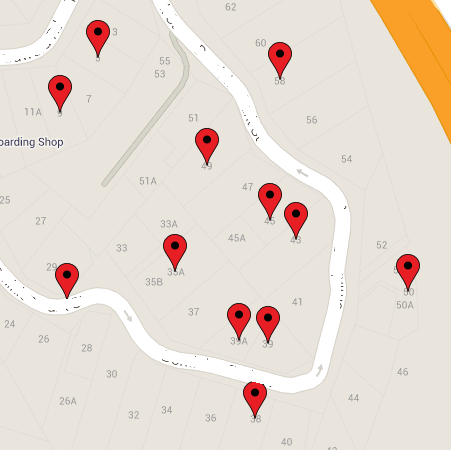
Clustered sales may occur in close proximity. In some cases vendor motivation may be boosted when a nearby sale achieves a result above expectations.
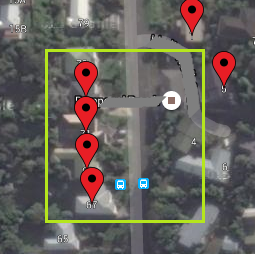
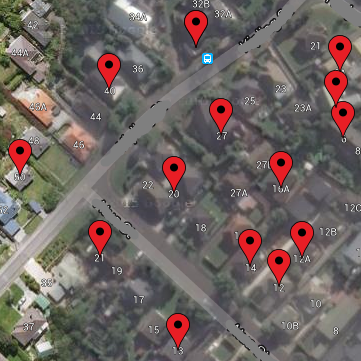
You can enable Satellite mode to help identify local amenities. Look for patterns of intense activity around high visibility areas such as bus routes.
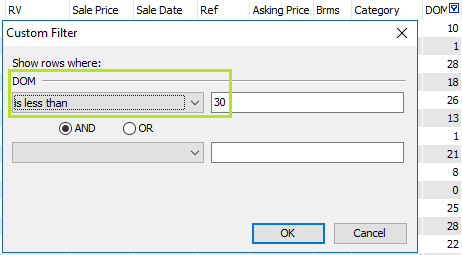
Try applying a Gallery column filter like: Days on Market = less than 30, to identify sought after pockets with above average turnover.
 |  |
Takeaways:
- Use market insights to help define your target area and improve the ROI for your prospecting efforts. Instead of targeting a large area, create a defined list of streets where sales occur more frequently.
- Where you detect patterns, increase your profile in these areas and look for emerging hot spots when a recent sale achieves a record result (bidders at auction, tenders, website views).
- Check local listings for obvious potential listings such as private sales, expiring listings, withdrawn listings, vacant investment properties.
 RSS Feed